


Vue de la ville de Kigali.© RFI/Stéphanie Aglietti
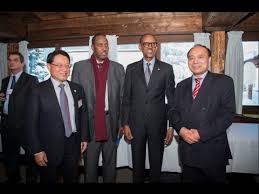
Des Journées européennes de développement au sommet du G7, Paul Kagame, actuel président en exercice de l’Union africaine, est invité partout, malgré son troisième mandat officiellement obtenu à près de 99% des suffrages exprimés. Même en France, malgré les accusations réciproques et l’interdiction de l’enseignement du français, c’est au Rwanda et à sa candidate Louise Mushikiwabo que le président Emmanuel Macron apporte son soutien pour le poste de secrétaire général de la Francophonie. Le Rwanda est présenté comme un modèle de développement pour l’Afrique et le bon élève de la politique de l’aide. Pourtant, tout comme sur la question des droits de l’homme et de la démocratie, de plus de plus de voix se font entendre pour critiquer ce modèle qui exclut des fruits de la croissance des millions de paysans rwandais parmi les plus défavorisés.
« Le Rwanda est aujourd’hui perçu comme l’un des pays les plus avancés et les plus respectés d’Afrique », justifie un porte-parole d’Arsenal. En s’achetant une manche du maillot de son équipe fétiche, Paul Kagame a créé une polémique, suscitant des critiques, y compris chez les parlementaires britanniques et néerlandais, deux pays qui ont longtemps été les soutiens du pays. Mais le célèbre club anglais persiste et signe, parlant d’un contrat de sponsoring signé après un processus d’évaluation menée par des « experts indépendants ». « Le Rwanda s’est transformé radicalement ces derniers temps », croit savoir le porte-parole du club.
Dans un contexte de restriction, de l’aide humanitaire internationale, le Rwanda qui figure toujours parmi les plus pauvres et les plus assistés d’Afrique, vient de débourser 40 millions de dollars sur trois ans pour cette campagne des plus ambitieuses, « Visit Rwanda ». Selon l’Agence rwandaise de promotion des investissements, avec cette simple mention sur un maillot vu 35 millions de fois par jour, selon le club, les revenus du tourisme devraient doubler sur les six prochaines années pour dépasser les 800 millions de dollars. L’une des principales attractions touristiques du Rwanda, ce sont ses parcs, ses volcans et les gorilles des montagnes chers à l’anthropologue Diane Fossey. Un fan d’Arsenal devra débourser 1 500 dollars pour une heure en leur compagnie. Comme dans d’autres secteurs, le petit Rwanda a toujours visé un tourisme haut de gamme, cantonné aux lodges et aux hôtels de luxe. Pour atteindre son objectif, il lui faudra entre 10 000 à 15 000 touristes supplémentaires par an, avec des poches bien garnies. Rien que l’on considère impossible au pays des Mille Collines, 24 ans après un génocide qui, selon l’ONU, a coûté la vie à 800 000 Tutsis et Hutus modérés, soit un dixième à l’époque de sa population.
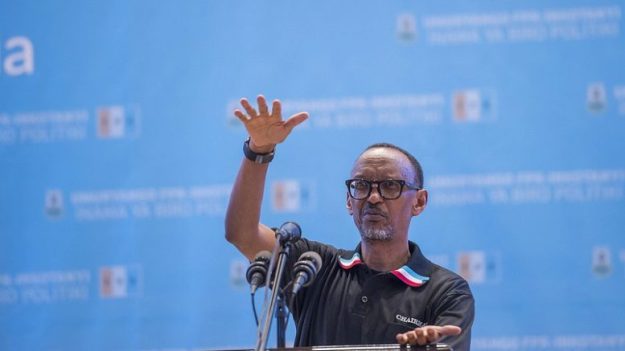
Aujourd’hui présenté par les bailleurs comme l’une des économies les plus dynamiques d’Afrique, le Rwanda a connu une croissance du PIB d’environ 8% par an entre 2001 et 2014, sous la conduite de son homme fort. L’ancien chef rebelle, Paul Kagame, prend officiellement le pouvoir six ans après le génocide. L’an dernier, le président rwandais s’est officiellement fait réélire à près de 99%. Une modification de la Constitution peut lui permettre aujourd’hui de garder les rênes du pays jusqu’en 2034. Il n’y a plus beaucoup de détracteurs pour lui barrer la route. Au Rwanda, presque tous les opposants ont été tués, emprisonnés ou vivent en exil, selon l’ONU. Même les bailleurs, sans doute sur fond de culpabilité liée au génocide, mais aussi peut-être par crainte de représailles, hésitent à le contredire.
Des distributions alimentaires ciblées
Dans une Afrique de l’Est et centrale soumise depuis 2014 à des sécheresses, des inondations à répétition causées par le changement climatique, le Rwanda est étrangement absent des rapports du Programme alimentaire mondial sur la sécurité alimentaire, comme si les phénomènes climatiques s’arrêtaient à la frontière. « C’est sans doute faute de données récentes », assure un porte-parole du PAM qui se dit bien conscient de la gravité de la sécheresse au Rwanda. Mais l’agence onusienne dit espérer être en mesure de publier dans les prochaines semaines les résultats préliminaires de l’analyse sur la sécurité alimentaire et la vulnérabilité des personnes au Rwanda. Quand la presse régionale fait état de déplacements dans les pays voisins de milliers de familles rwandaises frappées par la sécheresse, le HCR dit ne pas être informé.
L’existence des distributions alimentaires d’urgence était quasi-taboue au Rwanda. Des journalistes ont été inquiétés pour avoir voulu évoquer la question de la malnutrition. Mais en janvier 2018, le gouvernement rwandais a finalement reconnu avoir assisté en 2016 quelque 100 000 « foyers », soit plus d’un demi-million de Rwandais, avec une aide alimentaire d’urgence dans les provinces du sud et de l’est. Selon le New Times, quasi-agence de presse du régime, la ministre des Affaires sociales s’est engagée cette année encore à ce que « aucun Rwandais ne meure de faim », malgré une nouvelle période de sécheresse débutée en octobre 2017 puis des inondations qui ont déjà fait des centaines de morts.
Depuis le début de l’année, Kigali annonce tous les mois des distributions alimentaires ciblées et assure avoir suffisamment de nourriture pour tout le monde. Selon des documents internes au PAM, le gouvernement avait pourtant en 2016 demandé au moins une fois à l’agence onusienne d’assister quelque 125 000 Rwandais et l’agence onusienne avait planifié cette opération. Interrogé sur la fréquence et l’importance de ces distributions depuis, le Programme alimentaire mondiale assure que cette assistance ne s’est finalement pas révélé nécessaire et dit n’avoir fait depuis aucune distribution « à grande échelle » et « indiscriminée » à des Rwandais vivant au Rwanda. L’agence onusienne qui connaît de graves difficultés financières décrit comme une « évolution positive » le fait que Kigali se retrouve aujourd’hui seule en première ligne.
Les statistiques sont-elles truquées ?
En 2014, l’Institut rwandais des statistiques a annoncé que la pauvreté au Rwanda était en net recul, passant de 44,9 % en 2010 à 39,1% en 2014, soit une baisse de six points. L’Institut britannique OPM, qui jusque-là apportait un appui technique sur ce projet, s’est refusé à cosigner l’étude sans plus d’explication. Mais des chercheurs belges, comme Filip Reyntjens ou plus récemment Sam Desiere, ont remis en cause ces chiffres ; l’un dénonçant une manipulation derrière la « mise à jour » opérée par l’Institut rwandais dans le calcul du panier de consommation de base des ménages rwandais ; l’autre, démontrant que l’inflation était plus élevée que ce que les autorités pouvaient reconnaître.
Pour Sam Desiere, spécialiste de la question des statistiques dans les pays en voie de de développement, le taux de pauvreté au Rwanda n’aurait pas baissé de six points, mais augmenté d’un peu plus d’un point. Sur la même période, le taux d’inflation ne serait pas de 17%, mais de plus de 30%, ce qui entraînerait une plus grande vulnérabilité, notamment dans les couches les plus pauvres de la population rwandaise.
L’ancien expert de la Banque mondiale, Bert Ingelaere, en fait même une tribune dans le New York Times publiée le 2 août 2017 et intitulée « Le président pour toujours ». Quelques jours avant la réélection annoncée de Paul Kagame, il décrit publiquement comment, alors qu’il travaillait encore pour l’institution de Bretton Woods, on lui a demandé de ne pas poursuivre une étude dont les questions ne plaisaient pas au gouvernement rwandais. « Les questions étaient standard pour tous les pays, certaines portaient sur la gouvernance », précise Bert Ingelaere. « Je n’ai rien dit publiquement sur le coup parce que je pensais à la sécurité de nos équipes rwandaises sur le terrain », conclut ce désormais maître de conférences à l’Université d’Antwerp et auteur du livre Les cours Gacaca au Rwanda : rechercher la justice après le génocide.
Une autre experte explique avoir été elle aussi censurée. Elle avait effectué un rapport d’évaluation pour le compte d’une ONG d’un programme de lutte contre la pauvreté. « Mon rapport montrait des taux de malnutrition très inquiétants dans certains villages rwandais, l’ONG n’a pas voulu le publier parce que cela démontrait aussi que ses programmes n’avaient pas les résultats escomptés », confie encore l’experte. « Entretenir l’idée d’un miracle rwandais, ça profite tout autant aux bailleurs et aux ONG qu’au gouvernement rwandais », confirme un responsable d’ONG, qui poursuit : « Il y a une indulgence, sans doute emprunte d’un fond de culpabilité du génocide, mais qui ne rend pas compte de la réalité. »
Paul Kagame tape du poing sur la table
Au mois de février 2018, lors de la retraite organisée chaque année par le régime rwandais, le président Paul Kagame a lui-même tancé ses ministres pour les mauvais résultats en termes de malnutrition chronique. 37% des enfants de moins de cinq ans en souffrent toujours. « Est-ce que nous manquons à ce point de nourriture ? » a lancé l’homme fort du Rwanda, se disant fatigué de devoir répéter les mêmes choses. « Paul Kagame aime faire ça, il aime jouer les sauveurs, mettre le gouvernement en ordre, comme un PDG efficace », s’amuse un observateur. Officiellement, ces quatre dernières années, ce taux est resté quasi-inchangé. 37%, c’est six points de moins que son voisin, la République démocratique du Congo, souvent décriée pour sa mauvaise gestion.
De l’autre côté de la frontière, au Congo, avec un taux de malnutrition chronique de 43%, l’Unicef parle d’une « urgence silencieuse », d’un risque de retard dans l’éducation et le développement de ces enfants. Pour René Mugenzi, activiste rwandais en exil en Grande-Bretagne, la faim fait tellement partie du quotidien des Rwandais que pour pouvoir en parler sans violer le tabou, ils l’ont appelée « Nzaramba », ce qui signifie « que ta vie soit longue ». Un journaliste rwandais confirme : « C’est l’expression utilisée dans l’est du pays, mais il existe d’autres expressions “Warwaye ryani”, “Shira Umuteto”… Il y en a presque autant que de districts ». Pour les organisations paysannes rwandaises, certains de leurs partenaires, des chercheurs rwandais comme étrangers, cette insécurité alimentaire croissante dans certaines parties du pays n’est pas uniquement due au changement climatique.
Une mauvaise répartition de la croissance ?
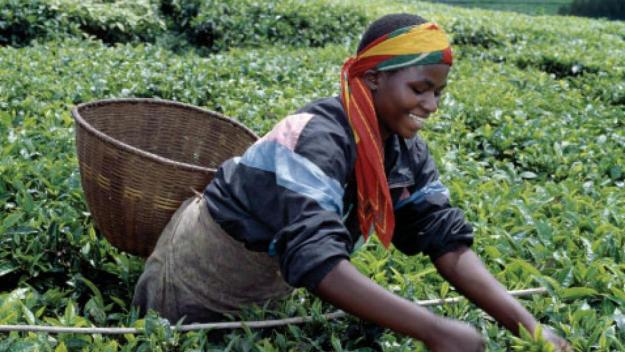
Il y a dix ans, le Rwanda s’engageait à bras le corps dans la « révolution verte » promue par le FMI et la Banque mondiale, imposant des cultures de rente comme le maïs ou le blé, plus sensibles aux aléas climatiques, et un développement à marche forcée, à coup de semences améliorées, de fertilisants et d’engrais chimiques, à des paysans rwandais qui constituent aujourd’hui encore la frange de la population la moins éduquée et la plus pauvre du Rwanda. La production agricole, elle, contribue pourtant à plus de 30% du PIB. « Il y a des réels gains de productivité, c’est un facteur à ne pas négliger dans un pays aussi densément peuplé », explique An Ansoms, professeure à l’université catholique de Louvain.
An Ansoms fait partie d’un collectif de chercheurs étrangers qui, depuis l’an dernier, tire la sonnette d’alarme. Cette course à la productivité aurait surtout bénéficié aux élites rwandaises, devenues les intermédiaires dans cette « révolution verte », et aux agriculteurs qui disposent d’au moins deux hectares, quand 70% des parcelles cultivables font aujourd’hui moins d’un hectare et que 70% de la population vit encore de ce qu’elle produit.
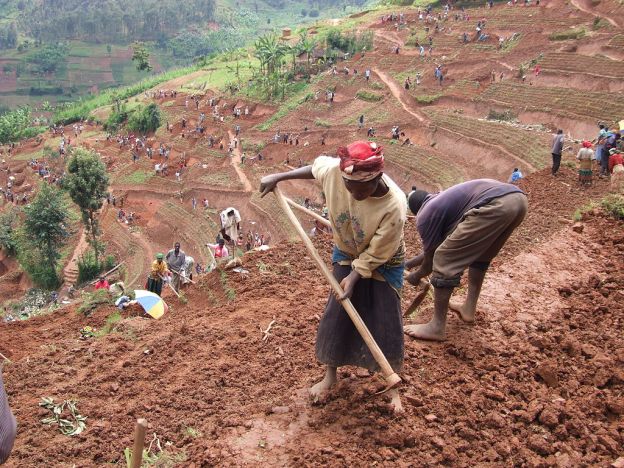
« Ce qui n’est jamais expliqué dans toute la littérature sur la révolution verte ou dans les success stories sur le Rwanda relayées par le gouvernement et les bailleurs, c’est que pour chaque Rwandais qui accepte d’ouvrir un compte en banque et toutes les conditions des politiques d’Etat, il y a au moins un Rwandais qui en est exclu », affirme Chris Huggins, professeur à l’université d’Ottawa et auteur de La réforme agricole au Rwanda : autoritarisme, marchés et zones de gouvernance, paru en octobre 2017.
Les paysans aussi se plaignent d’être les laissés pour compte du « miracle rwandais ». « Ce n’est pas comme pour tous les autres métiers, nous, c’est un peu comme si on opérait dans l’informel », déplore un paysan rwandais. « Quand on distribuait les cartes d’identité, toute personne qui n’avait pas de boulot, qui était chômeur et travaillait une heure par jour, était enregistrée comme un agriculteur. » Au Rwanda, 17epays le plus pauvre au monde, le taux de chômage est officiellement de 16,7%, un chiffre comparable à celui de l’Espagne, 14e puissance mondiale.
« Même ceux qui ont quelques ares de terrain, même l’agent de l’Etat, même la prostituée avec un jardin, sont considérés comme des agriculteurs. Et ça empêche de faire des politiques adaptées aux différentes catégories », peste encore l’agriculteur.
Pour lui, comme pour d’autres sur les collines rwandaises, il faut aujourd’hui assouplir les politiques publiques, offrir des « services spécifiques ». Même si l’Etat fait « beaucoup d’efforts », reconnaissent ces paysans, en subventionnant les intrants pour ceux qui acceptent de rejoindre son programme d’intensification des cultures, ces efforts restent tournés vers le développement d’un agrobusiness dans lequel l’Etat, le régime et leurs démembrements tiennent une place prépondérante. Une des sociétés du ministère de la Défense, l’APTC (Agro Processing Trust Corporation), a longtemps été l’un des principaux acteurs dans la chaîne d’approvisionnement en fertilisants et en semences. « Nous, tout ce qu’on demande, c’est un traitement équitable » conclut l’agriculteur.
Sonia Rolley
Source: RFI

 Des Journées européennes de développement au sommet du G7, Paul Kagame, actuel président en exercice de l’Union africaine, est invité partout, malgré son troisième mandat officiellement obtenu à près de 99% des suffrages exprimés. Même en France, malgré les accusations réciproques et la suppression de l’enseignement du français au primaire, c’est au Rwanda et à sa candidate Louise Mushikiwabo que le président Emmanuel Macron apporte son soutien pour le poste de secrétaire général de la Francophonie. Le Rwanda est présenté comme un modèle de développement pour l’Afrique et le bon élève de la politique de l’aide. Pourtant, tout comme sur la question des droits de l’homme et de la démocratie, de plus de plus de voix se font entendre pour critiquer ce modèle qui exclut des fruits de la croissance des millions de paysans rwandais parmi les plus défavorisés.
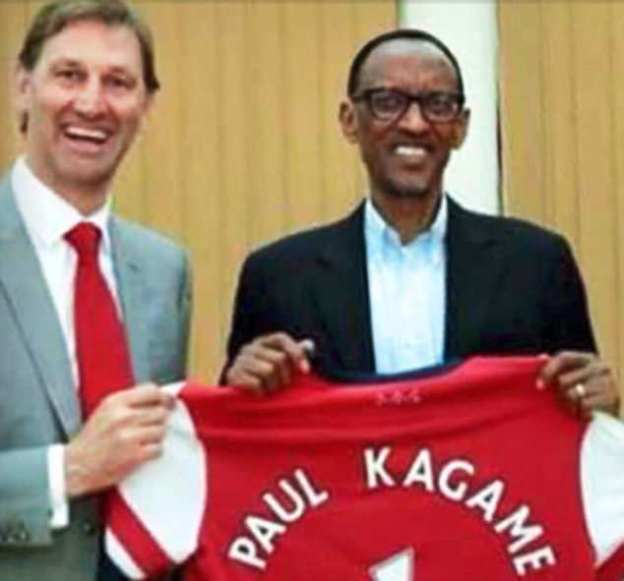

 ANTWERP, Belgium — There is an election in


.jpg)