Category Archives: Rwanda

Rwanda : meurtres, répression… le système Kagamé

Paul-Kagame-

Les Rwandais sont appelés aux urnes pour élire leur président… ou plutôt réélire Paul Kagamé, en place depuis 2000.

Les bureaux de vote ouvrent, vendredi 4 août, à Kigali au Rwanda et dans tout le pays. Ils vont attendre patiemment que les électeurs s’y pressent pour réélire le président sortant Paul Kagamé, pour un troisième mandat, qu’il a annoncé comme son dernier en mai. Le suspense n’est, en effet, pas de mise. Seuls deux opposants politiques ont été reconnus candidats officiels : Frank Habineza pour le Parti démocratique vert (PVD) et Philippe Mpayimana, candidat indépendant.

Pour les autres, la Commission électorale nationale les a écartés ou alors ils ont été victimes de campagnes de diffamation et de menaces. Mais finalement peu importe les opposants et leur nombre pour Paul Kagamé, qui répète à l’envi que l’élection est jouée depuis le référendum du 15 décembre 2015. Celui-ci l’a autorisé à se représenter jusqu’en 2034, avec 98,3% des voix. Un score impressionnant dans un pays connu pour sa répression politique.

Campagnes d’intimidation et menaces

Seuls deux opposants politiques ont donc réussi à braver les obstacles et à se faire reconnaître comme candidats officiels pour cette élection présidentielle. D’autres candidats en ont été empêchés. Le 3 mai dernier, Diane Rwigara par exemple a annoncé qu’elle se présenterait en tant que candidate indépendante. Dans les mois précédents, elle avait dénoncé publiquement la pauvreté, l’injustice, l’insécurité et l’absence de liberté d’expression au Rwanda. Une attaque directe envers le pouvoir. Quelques jours seulement après l’annonce de sa candidature, cette fille d’un financier du Front patriotique rwandais (FPR), parti de Paul Kagamé, mort dans des circonstances troubles, a fait l’objet d’une campagne de diffamation. Des photos où elle apparaissait dénudée ont circulé sur les réseaux sociaux. Elle et Philippe Mpayimana se sont également plaints que leurs représentants avaient été victimes de harcèlement et de manœuvres d’intimidation pendant qu’ils recueillaient les signatures nécessaires à la validation des candidatures.

Pour contrer cette répression, certains opposants vivent à l’étranger, comme l’abbé Thomas Nahimana. Ce candidat déclaré s’est pourtant vu plusieurs fois empêché de revenir d’exil. Même à l’étranger, il est donc difficile d’échapper à Kagamé. L’ancien chef des services de renseignements, Patrick KAREGEYA, a ainsi été retrouvé étranglé dans une chambre d’hôtel d’Afrique du Sud en 2014.

Deux décennies de répression politique

Deux décennies d’attaques contre les opposants politiques, les médias indépendants et les défenseurs des droits humains ont créé un climat de peur au Rwanda. C’est ce que dénonce Amnesty International, dans un rapport publié vendredi 7 juillet. L’ONG a donc décidé d’alerter sur le manque évident d’opposition politique et sur les dérives répressives du pouvoir.

Parmi les cas cités par le rapport, on trouve l’assassinat en mai de Jean Damascene Habarugira, un membre du parti non reconnu des Forces démocratiques unifiées (FDU), présidé par l’opposante Victoire Ingabire. Cette dernière a été condamnée en 2010 à quinze ans de détention pour “minimisation du génocide”.

“Depuis que le FPR est arrivé au pouvoir, il y a vingt-trois ans, il est difficile pour les Rwandais de participer à la vie publique et de critiquer ouvertement les politiques gouvernementales ; certains le paient même de leur vie”, a déclaré Muthoni Wanyeki, directrice du programme Afrique de l’Est, Corne de l’Afrique et Grands Lacs à Amnesty International.

Dans son rapport, Amnesty international exhorte donc l’Etat rwandais à entreprendre des réformes ambitieuses qui élargiront l’espace politique avant l’élection de 2024. Ce qui permettrait un débat véritable et l’expression d’opinions politiques diverses. Un travail de fond sur la liberté d’expression doit notamment être entrepris.

Répression médiatique

La liberté d’expression, c’est justement ce dont manquent les médias, fortement réprimés. Depuis des années, des journalistes sont emprisonnés, harcelés, parfois tués, et beaucoup ont été contraints à l’exil. En 2010, les journaux indépendants “Umuvugizi” et “Umuseso” ont été suspendus de parution pour avoir critiqué le régime, en pleine campagne électorale de réélection. Jean-Léonard Rugambage, alors rédacteur en chef adjoint del “Umuvugizi”, a été tué par balle à Kigali en 2010, alors qu’il enquêtait sur une tentative d’assassinat contre le général Kayumba Nyamwasa, passé dans l’opposition. En 2015, c’est le service rwandais de la BBC qui a été bloqué, l’un des seuls médias à délivrer une information indépendante. En 2016, au moins trois journalistes ont été arrêtés après avoir enquêté sur des sujets sensibles, comme la corruption et les morts suspectes.

Dans son rapport, Amnesty International invite le gouvernement à créer un mécanisme juridique pour enquêter sur les violations des droits de l’homme. Un défi, tant que Paul Kagamé reste au pouvoir.

Un bilan contrasté

Malgré l’utilisation d’un régime répressif toujours plus violent pour se maintenir en place, Paul Kagamé possède un bilan jugé positif sur le plan économique : croissance de 7 %, population couverte à 91 % par l’assurance-maladie, politiques efficaces de lutte contre la corruption. Ce qui corroborerait pour certains la popularité “indéniable” du président. Paul Kagamé, à la tête du Front patriotique rwandais, a contribué à mettre fin au génocide qui a fait plus de 800.000 morts 1994. “The Boss” comme on l’appelle à Kigali, a toujours été élu avec plus de 90 % des voix, dans ce pays de 11,5 millions d’habitants.

Mais la répression en vigueur va une fois encore empêcher de connaître la vraie valeur de ce vote : vote d’adhésion, de peur ou de dépit ?

Justine Benoit

Source: L’OBS

Umunyagitugu Paul KAGAME acyuye igihe. Ni iki kitezwe muri politiki y’u Rwanda ?

kagame

Guhera tariki ya 05 /08/2017 Paul Kagame waranzwe no gutegekana igitugu guhera mu mwaka wa 1994 azaba atakiri Perezida wa Repubulika y’u Rwanda. Itegekonshinga yarahiriyeho ryamwemereraga kugeza kuri manda ebyiri gusa kuko nta narimwe umuntu yemererwa kuyobora manda zirenze izo. Umunyagitugu abonye manda ebyiri zirangiye yashatse gukora itekinika ngo itegekonshinga rihindurwe bityo yemererwe kwiyamamaza indi nshuro. Cyakora na nyuma ya referendumu ififitse, Paul Kagame ntiyemerewe kwiyamamaza. Abaza gusoma ibi baribaza bati none se ko tumaze minsi tubona Kagame yiyamamaza, ubwo si uko abyemerewe?

Igisubizo kuri iki kibazo kigaragararira mu gisobanuro, imyitwarire n’imikorere y’umunyagitugu. Kagame nk’umunyagitugu wakuye agahu ku nnyo ntakeneye itegeko iryo ariryo ryose ngo yiyamamaze. Ni umunyagitugu utagendera ku mategeko. Kuri we amategeko icyo amaze ni ukwiyerekana mu rubuga mpuzamahanga ariko mu by’ukuri igifite agaciro ni amabwiriza we yishyiriraho ngo agere kubyo ashatse. None se Abanyapolitiki ntibafungwa mu Rwanda kandi itegekonshinga ribemerara gukora umurimo wa politiki? Kwandikisha amashyaka atavuga rumwe na FPR se ntibyabaye ikibazo kandi nyamara u Rwanda rwemera amashyaka menshi? Abaharanira uburenganzira bw’ikiremwamuntu se bo basiba guhungetwa kandi nyamara u Rwanda rwarasinye amasezerano mpuzamahanga agena uburenganzira bw’amashyirahamwe guhera mu mwaka wa 1975? Abantu se birirwa bicwa buri munsi kandi nyamara igihano cy’urupfu kitaravanyweho mu mategeko y’u Rwanda? Kagame ntacyo amategeko amubwiye we ashaka kwigumanira ubutegetsi ngo akomeze ahonyore abenegihugu uko yishakiye ari nako akomeza kwikubira ibyiza by’igihugu. Na manda Paul KAGAME azategeka guhera ku itariki ya 05/08/2017 ntizaba yemewe n’amategeko niyo mpamvu azaba ari umuperezida utemewe, ufite ubutegetsi butemewe, bugomba gusimburwa vuba na bwangu.

Ni iki kitezwe muri iyi manda ?

  1. Mu rubuga mpuzamahanga: Kagame azaba yamaze guta ibara yitwa umunyagitugu nk’abandi bose, umujura, umunyakinyoma ndetse na bya byaha bye benshi bajyaga batinya kuvuga bazabigarukaho. Bya bigwi n’imidari yajyaga yambikwa ngo yahagaritse jenoside bizahagarara kuko iyo umuntu akoze ibyiza akabirenzaho ibibi byose biba bibi gusa. Niko isi ikora, ni nako tuyibamo.

Cyakora kubera ko Paul Kagame yaryohewe n’ibyo yabonye, azatanga amafranga y’umurengera agure abanyamakuru n’ibigo bikomeye kugira ngo bigerageze kwerekana ko isura ye itari mbi nk’uko igaragara! Hari ibintu bimwe na bimwe batazashobora gukiza Kagame : Nko kuba atihanganira abatavuga rumwe n’ubutegetsi bwe ntazashobora kubihindura. Kuba mu myaka amaze ku butegetsi atarashoboye kureka ngo abandi bagaragaze impano zabo mu miyoborere ntazapfa kubishobora ngo nibura afungure imfungwa za demokarasi Ingabire Victoire, Deo Mushayidi n’abandi. Kuba mu bo batangiranye umugambi benshi baramucitseho bizakomeza kumwokama.

Kagame azakomeza kugerageza kwiyegereza abahutu b’inkomamashyi agamije kugaragaza ko atavangura ariko ntazashyiraho chef d’état-major cyangwa ministiri w’ingabo utari uwo muri FPR. Abatutsi batinyuka kwamagana politiki ya Kagame nka Kizito Mihigo na Diane Rwigara bazakomeza kwitwa abanzi b’igihugu.

  1. Mu rubuga rwa politiki nyarwanda: Abaturage bazakomeza guceceka ngo bategereje ko Imana izabakuriraho Kagame. Amashyaka ya opozisiyo akorera hanze azakomeza kwamagana ubutegetsi bwa Kagame ariko arasabwa gushaka udushya. Abalideri bazakomeza kuba bakeya ndetse abazifuza kuva mu mahanga ngo batashye mu Rwanda gufatanya na rubanda Kagame ntazabemerera. Guverinoma y’u Rwanda ikorera mu buhungiro izarushaho kumvikanisha ibibazo by’u Rwanda ari nako yotsa igitutu ubutegetsi bw’umunyagitugu ngo bwemere gufungura urubuga rwa politiki. Urukiko Mpanabyaha rwa Rubanda rwashyizweho na rubanda ruzakira ibirego rukore kandi ruburanishe amadosiye y’abayobozi bakekwaho ibyaha bya jenoside, ibyibasiye inyokomuntu n’ibyaha by’intambara. Ibihano bazabahwa bizashyikirizwa ibihugu n’umuryango mpuzamahanga kugira ngo aba bantu bafatirwe ibihano. Abazaba bahamwe n’ibyo byaha bazagira ibibazo mu kubona visa zo kwinjira mu bindi bihugu, imitungo yabo iri hanze izafatirwa, kandi ntibazemererwa ubuhungiro mu gihe bazaba babusabye. Uzagerageza gusohoka azafatwa maze ashyirwe aho agomba kurangiriza ibihano. Abitwaje intwaro barwanya Kagame bazaba bafite impamvu yo kugaba ibitero ariko imbaraga zabo zizakomeza kuba nkeya ku mpamvu nyinshi zitandukanye. Ku ruhande rwa APR, abasirikare benshi batangiye urugamba rwa 1990 bazaba bageze mu gihe cy’iza bukuru, bityo Kagame azajya yirukana uwo ashatse yitwaje ibyo.

Ubutegetsi bwa Kagame buzaba butemewe ariko nta munyamahanga uzabukuraho uretse kubuvuga nabi. Abemera iby’ubuhanuzi n’indagu bahamya ko Kgame atazabasha gutegeka iyi myka irindwi igiye kuza, cyakora umupira uri mu kibuga cy’abanyarwanda ubwacu. Turasabwa gukora ibirushije ubukana ibyo twakoraga mbere, gufata ibyemezo bisharira no kwirinda utunyungu tw’abantu ku giti cyabo.

Biracyaza…

Rwanda’s Forever President

kagame-fpr-bureau-politiqueANTWERP, Belgium — There is an election in Rwanda on Friday, but its outcome already is nearly certain: President Paul Kagame will win a third seven-year term. Elections there are not a contest for power. They are the ritual confirmation of the power in place.

Mr. Kagame generally wins by margins that would make a dictator proud: In 2010, he scored some 93 percent of the vote. He is the only ruler most Rwandans born since the 1994 genocide know. The Rwandans who remember leaders before him have reason to wonder if they will ever see another: The state’s mighty security apparatus is quietly eloquent, with all those soldiers and police officers routinely patrolling both city streets and the countryside.

Mr. Kagame is up against two innocuous candidates after the national election commission disqualified Diane Rwigara, his strongest opponent, and two other independent contenders. The opposition leader Victoire Ingabire, who was placed under house arrest in the lead-up to the 2010 election, is now in jail serving a dubious 15-year sentence for threatening state security, among other things. Journalists have also been intimidated and stifled; Freedom House categorizes Rwanda as “not free.”

Mr. Kagame wasn’t supposed to run this time because he would be coming up against the two-term limit set by the Constitution. But in 2015 the government proposed an amendment and had it sanctioned in a referendum (roundly criticized by human rights groups), opening the way for Mr. Kagame to stand for re-election this year — and again until 2034.

Burundi was condemned internationally in 2015 after President Pierre Nkurunziza flouted term limits to run for a third mandate. Last year, President Joseph Kabila of the Democratic Republic of Congo skirted term restrictions by simply delaying the next election, triggering protests and then a crackdown that led to sanctions against his government. Yet nothing of the sort has happened to Mr. Kagame or his administration despite its ploys to keep him in power basically unchallenged.

Why? Because Mr. Kagame has been masterful at deflecting criticism of his illiberalism by pointing to Rwanda’s economic performance. The country is touted as a model: The government claims that the economy grew by an average of about 8 percent a year between 2001 and 2014, and that the rate of poverty dropped from nearly 57 percent in 2006 to less than 40 percent in 2014. Neither Mr. Nkurunziza nor Mr. Kabila could proffer such results.

Mr. Kagame’s supporters, in Rwanda and beyond, sing to his tune. In a way, they have to. Western donors and international organizations may well prefer democratic values to big-man politics. But having poured great sums of money into Rwanda since the 1994 genocide, they want to be impressed by the headway Mr. Kagame claims to have made — on economic growth and poverty reduction, but also maternal health care and the prosecution of suspected mass killers. Asia has tigers; now Africa has found its lion. Many want to believe that while Mr. Kagame may have been cutting corners on democracy, he has delivered on development.

Has he, though?

In fact, his government’s record is shakier than it looks, including on some of the major achievements it is credited with.

Consider poverty reduction. Back in 2005, I was stationed in Rwanda with a World Bank team, working on a large-scale study of poverty. Six months into it, after we had collected hundreds of survey questionnaires about the well-being of ordinary Rwandans and conducted hundreds of discussions with villagers, the Rwandan security forces seized half of our files on the pretext that our research’s design was tainted by “genocide ideology” — a vague notion supposedly something like sectarianism that the government often invokes to criminalize what it sees as challenges to its authority. After lengthy negotiations between World Bank and Rwandan officials, the project was abandoned. We never determined what the poverty trends were: The information we had collected was destroyed before it could be analyzed.

Matters have hardly improved. Major studies can only be carried out by the Rwandan authorities or under their close supervision. Independent researchers have come to question the government’s methodology for analyzing data.

Officially, the poverty rate decreased by nearly 6 percentage points between 2011 and 2014. But Filip Reyntjens, a Rwanda expert at the University of Antwerp, has argued that it might actually have increased by about 6 percentage points during that period. Several articles published by the Review of African Political Economy also challenge Rwanda’s official poverty figures, as well as its G.D.P. growth rates.

I’m of the view that expanding individual freedoms is essential, not incidental, to a country’s long-term development. As Angus Deaton, a Nobel laureate in economics, said to a Rwandan minister in 2015, “improvements in public health can never be truly secure in nondemocratic states.” But I concede that Rwanda has made remarkable economic progress since facing near-total destruction in 1994, and that some think it is still worth debating the merits of trade-offs between democracy and development.

Whatever one thinks of these issues, however, everyone should be concerned that the Kagame government has been fudging, hiding or selectively presenting the raw facts of its economic record. Rwanda may be forgoing democracy for development only to wind up with no democracy and far less development than many think.

The Government of Rwandan People in Exile: Reshuffle and People’s Tribunal

SAFARI Justin

Mr. Justin SAFARI enters Ministry of Justice which is symbolically led by Déo MUSHAYIDI (in Rwanda’s Prison). The Former Prime Minister, Abdallah AKISHULI becomes the Attorney General of the People’s Tribunal while Ms Immaculée KANSIIME UWIZEYE replaces him keeping at same time the diplomacy portfolio.

DSC_0019

From left: Abdallah AKISHULI, Immaculée KANSIIME UWIZEYE and Thomas NAHIMANA. Photo archives Mininfo GREX.

Press Statement

Cabinet reshuffle within the Government of Rwanda in Exile

  1. By the virtue of the powers conferred upon him by Articles 14, 15 and 16 of the Charter governing the Government of the Rwandese People in Exile signed on 23 February 2017 in Paris, France;
  2. Considering the unbecoming behavior of the Rwandan dictator Paul Kagame who rejected the proposals for the urgent need for the opening up of political space in Rwanda made by the Government of the Rwandan people in exile, thus opting de facto for the way of “an absolute monarchy” under the deceptive image of a republic actually emptied of its true substance;
  3. Implementing the resolution of the Government Council of 23 April 2017, which established the “People’s Tribunal” to investigate crimes against humanity, war crimes and crimes of genocide committed by certain senior political and military officials since 1 October 1990, which until now enjoy unacceptable impunity;
  4. His Excellency the President of the Government of the Rwandese People in Exile, Thomas Nahimana, appointed the High Authorities of the People’s Tribunal as follows:
    1. The Attorney General of the People’s Tribunal: Mr. Abdallah AKISHULI
    2. The Presiding Judge of the People’s Tribunal: Mr. Vénant NKURUNZIZA

5. His Excellency the President of the Rwandan People’s Government in Exile has appointed members of the cabinet of ministers as follows:

    1. Prime Minister: Mrs. Immaculée KANSIIME UWIZEYE
    2. Vice-Prime Minister: Mrs. Nadine Claire KASINGE
    3. Minister of Justice: Mr. Déogratias Mushayidi represented by Minister Justin SAFARI
    4. Minister of Culture, Family and Women Empowerment: Mrs. Victoire INGABIRE UMUHOZA represented by Mrs. Nadine Claire KASINGE
    5. Minister of Information: Mr. Chaste GAHUNDE
    6. Minister of Education: Mrs. Chantal MUKAMANA MUTEGA
    7. Minister of Interior and Local Development: Mr. Daniel NDUWIMANA
    8. Minister of Commerce and Finance: Mrs. Marine UWIMANA
    9. Minister of Agriculture, Livestock and Land: Mr. Jean Léonard SEBURANGA
    10. Minister of Refugee Condition and Eradication of Causes of Asylum: Mrs. Virginie NAKURE
    11. Minister of Infrastructure and Habitat: Reverend Father Gaspard NTAKIRUTIMANA
    12. Minister of Health and Citizen’s Well-fare: Mrs. Spéciose MUJAWAYEZU

6. GOVERNMENTSPOKESPERSONS :

  1. Chaste GAHUNDE
  2. Immaculée KANSIIME UWIZEYE
  3. Marine UWIMANA

Done in Paris on July 31, 2017
Chaste GAHUNDE
Minister of Information, Government Spokesperson

IMG-20170227-WA0049

COMMUNIQUE DE PRESSE: Remaniement ministériel au sein du gouvernement du peuple rwandais en exil

SAFARI Justin

Monsieur Justin SAFARI est le nouveau Ministre au sein du Ministère de la Justice de Monsieur Déo MUSHAYIDI. L’ancien Premier Ministre, Abdallah AKISHULI cède la place à Mme Immaculée KANSIIME UWIZEYE pour devenir le Procureur général du Tribunal du Peuple dont la mission est juger les crimes contre l’humanité, crimes de guerre et de génocide commis par les hautes autorités militaires et politiques qui jusq’aujourd’hui jouissent d’une impunité inacceptable.

 Communiqué de Presse

  1. En vertu des pouvoirs qui lui sont conférés par les articles 14, 15 et 16 de la Charte régissant le Gouvernement du Peuple Rwandais en Exil signé en date du 23 février 2017 à Paris en France ;
  2. Tenant compte du comportement indigne du dictateur rwandais Paul Kagame qui a rejeté les propositions en rapport avec l’urgente nécessité de l’ouverture de l’espace politique au Rwanda formulées par le Gouvernement du peuple rwandais en exil, optant de facto pour la voie « d’une monarchie absolue » sous les dehors trompeurs d’une république en réalité vidée de sa substance ;
  3. Mettant en application la résolution du conseil gouvernemental du 23 avril 2017 qui a institué le « Tribunal du Peuple » avec mission de juger les crimes contre l’humanité, les crimes de guerre et crimes de génocide commis par certains hauts responsables politiques et militaires depuis le 1 octobre 1990 qui, jusqu’aujourd’hui, jouissent d’une impunité inacceptable ;
  4. Son Excellence le Président du Gouvernement du peuple rwandais en exil, Thomas Nahimana, a nommé les hautes autorités du « Tribunal du Peuple » comme suit :
  • Le Procureur Général du « Tribunal du Peuple » : Monsieur Abdallah AKISHULI
  • Le Juge Président du « Tribunal du Peuple » : Monsieur Vénant NKURUNZIZA

5. Son Excellence le Président du Gouvernement du peuple rwandais en exil a remanié le gouvernement comme suit :

  1. Premier Ministre : Madame Immaculée KANSIIME UWIZEYE
  2. Vice – Premier Ministre : Madame Nadine Claire KASINGE
  3. Ministre de la Justice : Monsieur Déogratias MUSHAYIDI représenté par le Ministre Justin SAFARI
  4. Ministre de la Culture, Famille et Promotion de la Condition Féminine : Madame Victoire INGABIRE UMUHOZA représentée par Madame Nadine Claire KASINGE
  5. Ministre de l’Information : Monsieur Chaste GAHUNDE
  6. Ministre de l’Education : Madame Chantal MUKAMANA MUTEGA
  7. Ministre de l’Intérieur et du Développement local : Monsieur Daniel NDUWIMANA
  8. Ministre du Commerce et des Finances : Madame Marine UWIMANA
  9. Ministre de l’Agriculture, Elevage et des Terres : Monsieur Jean Léonard SEBURANGA
  10. Ministre de la Condition des Réfugiés et Eradication des Causes de l’Asile : Madame Virginie NAKURE
  11. Ministre de l’Infrastructure et Habitat : Révérend Père Gaspard NTAKIRUTIMANA
  12. Ministre de la Santé et du Bien-être du citoyen : Madame Spéciose MUJAWAYEZU

DSC_0019

 De gauche à droite: Abdallah AKISHULI? Procureur général, Immaculée KANSIIME UWIZEYE, Premier Ministre et Thomas NAHIMANA, Président .

6. LES PORTE-PAROLES DU GOUVERNEMENT :

  1. Monsieur Chaste GAHUNDE
  2. Madame Immaculée KANSIIME UWIZEYE
  3. Madame Marine UWIMANA


Fait à Paris le 31/07/17

Chaste GAHUNDE
Ministre de l’Information, Porte-Parole du Gouvernement

IMG-20170227-WA0049

IVUGURURWA RYA GUVERINOMA Y’URWANDA IKORERA MU BUHUNGIRO

DSC_0019

Uhereye i bumoso: Bwana Abdallah AKISHULI, umushinjacyaha mukuru w’urukiko rwa rubanda, Madame Immaculée KANSIIME UWIZEYE, Ministre w’intebe, Padiri Thomas NAHIMANA, Perezida.

Itangazo rigenewe Itangazamakuru

IVUGURURWA RYA GUVERINOMA Y’URWANDA IKORERA MU BUHUNGIRO

  1. Ashingiye ku bubasha ahabwa na « CHARTE » igenga Guverinoma y’u Rwanda ikorera mu buhungiro yasinyiwe i Paris taliki ya 23 Gashyantare 2017 cyane cyane mu ngingo zayo 14,15 na 16 ;
  2. Ashingiye ku myitwarire igayitse y’Umunyagitugu Paul Kagame wakomeje kunangira umutima ntiyite ku nama nziza yo gukingura urubuga rwa politiki yagiriwe na Guverinoma ya rubanda ikorera mu buhungiro ahubwo akiyemeza kugundira ubutegetsi mu nyungu ze bwite agamije kuzabukurwaho n’urupfu gusa ;
  3. Ashingiye ku byemezo by’inama ya Guverinoma ya rubanda yo kuwa 23/04/2017 yashyizeho « Urukiko Rwa Rubanda » rushinzwe gukurikirana « abayobozi » bashinjwa ibyaha by’intambara, ibyibasiye inyoko-muntu n’ibyaha bya jenoside byakorewe abanyarwanda guhera taliki ya 1 Ukwakira 1990, bikaba kugeza ubu bitarahanwa n’inkiko ;
  4. Nyakubahwa Perezida wa Guverinoma y’u Rwanda ikorera mu buhungiro Padiri Thomas NAHIMANA yashyizeho  abayobozi b’inzego nkuru z’ « Urukiko Rwa Rubanda » ku buryo bukurikira:
    1. Umushinjacyaha Mukuru w’Urukiko rwa Rubanda (Procureur Général): Bwana Abdallah AKISHULI
    2. Umucamanza Mukuru w’Urukiko rwa Rubanda: Bwana Vénant NKURUNZIZA
  5. Nyakubahwa Perezida wa Guverinoma y’u Rwanda Padiri Thomas NAHIMANA ikorera mu buhungiro yashyize mu myanya aba Ministre ku buryo bukurikira:
    1. Ministre w’Intebe ufite n’Ububanyi n’Amahanga mu nshingano : Madame Immaculée Kansiime UWIZEYE
    2. Ministre w’Intebe wungirije: Madame Nadine Claire KASINGE
    3. Minisitiri w’Ubutabera: Bwana Déogratias Mushayidi uhagarariwe na Ministre Justin SAFARI

SAFARI Justin

Min.Justin SAFARI (Kentuchy, USA)

4. Minisitiri w’Umuco, Umuryango, Guteza imbere umwari n’umutegarugori: Madame Victoire INGABIRE UMUHOZA uhagarariwe na Madame Nadine Claire KASINGE

5. Minisitiri w’Itangazamakuru : Bwana Chaste GAHUNDE

6. Ministre w’Uburezi : Madame Chantal MUKAMANA MUTEGA

7. Minisitiri w’Ubutegetsi bw’igihugu n’Iterambere ry’Umurenge: Bwana Daniel NDUWIMANA

8. Minisitiri w’Imari n’Ubucuruzi: Madame Marine UWIMANA

9. Minisitiri w’Ubuhinzi, Ubworozi n’Ubutaka : Bwana Jean Léonard SEBURANGA

10. Minisitiri ushinzwe Kurengera Impunzi no gukemura ikibazo gitera ubuhunzi : Madame Virginie NAKURE

11. Minisitiri w’Ibikorwa-remezo n’Imiturire : Padiri Gaspard NTAKIRUTIMANA

12. Minisitiri w’Ubuzima n’Imibereho myiza y’Abaturage : Madame Spéciose MUJAWAYEZU

ABAVUGIZI BA GUVERINOMA :

  1. Bwana Chaste GAHUNDE
  2. Madame Immaculée KANSIIME UWIZEYE
  3. Madame Marine UWIMANA

Bikorewe i Paris tariki ya 31/07/17
Chaste GAHUNDE
Minisitiri ushinzwe itangazamakuru, umuvugizi wa Guverinoma

IMG-20170227-WA0049

Short of arguments, Rwanda Diplomacy Chief threatens the critics!

LMUs

This is what Minister Louise Mushikiwabo tweeted in Kinyarwanda. The derogatory, very racist tweet was aimed at whites and other non-whites who have been critical of the regime she works for as Foreign Minister, led by dictator Paul Kagame.

I am sick and tired of utuzungu said Mushikiwabo. In Kinyarwanda, Umuzungu means a white person. When you replace the first 3 letters “umu” by “utu”, then the word becomes pejorative. It is a common way of formulating an insult  in Kinyarwanda. In this case it means that those whites are subhumans, small (insignificant)  and beneath her. Rwandans do this a lot. They call people they don’t like subhumans. Before the genocide, Tutsis were called cockroaches and subhumans. It is sad that Rwanda’s Foreign Affairs Minister used the same language, same rhetoric as genocidaires. Of all people, Minister Mushikiwabo should know how labeling other races subhumans simply because they shed some light on your government’s human rights abuses is wrong. Instead of refuting those accusatory reports by facts, she resulted to attacks and insults. She chose Kinyarwanda hoping they will never know maybe!

Here is more Kinyarwanda lesson. Abagabo means men. If you want to insult a bunch of men, you can call them utugabo. It is a disrespectful way of saying that they are a bunch of useless nobodies. In Rwandan culture, there is no grave insult than this, especially when this insult is uttered by a woman. Rwanda is still a society where a woman is supposed be genteel and to have ladylike behavior all the time especially the bourgeoisie and higher ups.

The kind of language Minister Mushikiwabo used, normally is for street walkers and thugs. It is the equivalent of ghetto or hood talk in the US. This is why the tweet was scandalous. Many Rwandans were flabbergasted even shocked by that bad language coming from someone in charge of diplomacy and foreign relations, the government spokeswoman. A woman who uses that kind of language in Rwanda is called “inshinzi” (Huchi mama, vulgar with no self worth) and it is normally not proper for a high ranking official to use that kind of language!

Minister Mushikiwabo accused those whites she qualified of subhumans of writing “amateshwa” about Rwanda. Here she was referring to recent reports condemning human rights abuses by the government of dictator Paul Kagame. In Kinyarwanda amateshwa means rubbish, nonsense, words coming out of a mouth of someone who is stupid, dumb, non important, demented, someone so irrelevant that you have no time for whatever they are saying.

Finally, Mushikiwabo asked “utuzungu”, those insignificant white subhumans who put them in charge of Africa? They need to butt out of african affairs she said!

Source: Iwacuheza.com

Faking it: The Rwandan GDP Growth Myth

This is a follow up to the blog-post, which was published on roape.net on 31 May, 2017, in which we showed that poverty increased by between 5 and 7 percentage points between 2010 and 2014 in Rwanda, even as the government claims it decreased by 6 percentage points. The blogpost concluded that the information emerging from the household survey data appeared to be incompatible with the official figures on economic growth, and invited researchers to more closely scrutinize the data coming out of the National Institute of Statistics of Rwanda (NISR). Indeed, with agriculture accounting for more than one third of GDP and two thirds of the workforce, it is difficult to imagine a scenario in which total GDP growth could average between 6% and 8% annual growth, while incomes in the agricultural sector appear to be decreasing for a substantial proportion of farmers. This blogpost tries to substantiate those claims using the NISR’s Integrated Household Living Conditions Survey (EICV) data as well as looking at more recent trends in relevant macroeconomic variables.

According to economic theory, GDP per capita measured from National Account Statistics (NAS) should be equivalent to average income or consumption measured from Household Surveys (HHS). In practice, this is rarely the case because of measurement errors. For instance, households tend to deliberately under-report earnings, while NAS have trouble capturing illicit and informal economic activity (read Ken Simler’s 2008 paper on this theme). Even when there are differences in levels of income estimated by the two methods, however, Martin Ravallion (2003) concludes that, “NAS consumption growth rate is an unbiased predictor of the HHS consumption growth rate.” Furthermore, he finds that NAS/HHS estimates should converge over time as the economy develops and becomes more formalized.[1]

In figure 1 below, we show the evolution of average household consumption between 2000 and 2013 in Rwanda, as estimated from the EICV datasets and nominal GDP per capita in local currency units, as reported in the World Bank’s World Development Indicators databank. [2] As the graph shows, estimates of average income/consumption from the EICV and national accounts were almost identical in 2000 and 2005, and started to grow apart thereafter. By 2013, the national account estimate was more than 50% higher than the average consumption estimated from the EICV. This does not constitute incontrovertible proof that GDP growth rates have been over-estimated in Rwanda, since there are different factors listed above that could explain such discrepancies. But it does strongly suggest that something is amiss in Rwanda’s GDP growth figures. At the very least, it does raise serious questions about the reliability of national account statistics, which the government and donors rely on to claim the success of their policies. As mentioned in our previous blogpost, GDP figures are easier to manipulate than household survey data, as the Greek case famously showed a few years back.

Figure 1: GDP per capita vs. Average EICV consumption

Source: EICV1-4, World Bank WDI

Even if we were to conclude that growth data have not been manipulated in the past, there are reasons to be concerned about the current performance of the Rwandan economy. The most recent growth data coming out of Rwanda shows that economic growth slowed to its lowest level since 2002 (1.7%) in the first quarter of 2017. With a population growth rate of 3% per year, this means that Rwanda’s GDP per capita growth rate is now effectively negative, even according to the NISR’s own estimates (see figure 2 below).

Figure 2: GDP Annual Growth Rate

Source: tradingeconomics.com

This should come as no surprise to those who have paid attention to the facts behind the dazzling numbers that Rwanda and its donors like to boast about. While there has been undeniable progress since the war, much of the improvements we see in Kigali today are cosmetic and driven by the government’s obsession to portray an image of success rather than to lay the foundations of lasting economic growth. As we mentioned in the previous blogpost, much of the investments have been financed with public debt, leading to a surge in external debt levels (see figure 3 – remember that actual debt to GDP ratios may be even higher, if GDP has been overestimated as our analysis suggests).

Figure 3: Debt to GDP

Source: tradingeconomics.com

This would all be fine, if the investments had been strategically targeted at growth areas aimed at leapfrogging development Korean style. But to date, the vast majority of investments have gone into cosmetic – and crucially loss-making – prestige projects, such as the Kigali Convention Centre, Rwanda Air, Kigali skyscrapers and luxury housing units for the non-existent Rwandan upper-middle class. Even if these investments were not making a loss, this would arguably be a questionable use of public resources, since they are all highly regressive and aimed at subsidizing the super-rich or foreign clients.  Rather than enabling economic development, these projects cost the Rwandan taxpayer dearly in running costs and take away precious resources from more pressing areas of development, such as the agricultural sector. The result of these irresponsible investments is beginning to  be felt. For the first time in recent years, capital account flows to Rwanda were negative by a large margin in 2016, indicating that investors may be starting to put their assets abroad (see figure 4 below).

Figure 4: Capital Flows

Source: tradingeconomics.com

At the same time, Rwanda’s current account deficit reached a whopping 16.6% of GDP, even as the government put in place draconian measures to restrict imports (see figure 5)

Figure 5: Current Account

Source: tradingeconomics.com

With such economic fundamentals, it is not surprising that the value of the Rwandan franc has almost been halved in the past few years (see figure 6 below):

Figure 6: Rwf/ USD exchange rate

Source: tradingeconomics.com

The situation is likely to get worse, not better, over the coming years as even larger prestige projects come online and existing ones start accumulating more losses. The East African reported on 3 July that “Rwanda’s foreign reserves are expected to fall below the East African Community’s convergence criterion of four months [of imports] in the coming year” and may fall below IMF’s critical threshold of three months of imports.

The conclusion of this brief analysis is that if there ever was a Rwandan economic miracle it has probably fizzled out some time ago and is likely to come crashing down very soon. At the very least, the data shows that the development strategy adopted by the Rwandan government is risky in the extreme, bordering on reckless. The closest example we can find in recent history of similar policies is Mobutu’s Zaire that squandered the country’s resources on space projects, nuclear power plants and a Concord airplane. As outlandish as they seem today, these projects also helped to give Mobutu an image of success up until the 1970s (remember the Rumble in the Jungle?) But Rwanda’s PR machine has even surpassed Mobutu’s, having managed to keep the narrative of success going for all these years even as evidence to the contrary has been in plain sight, or just below the surface waiting to be scratched. Even today, there is not a single article in the press (even the critical ones) that does not mention Rwanda’s alleged economic success, and its low levels of corruption – forgetting to mention that close associates of Kagame appeared in the Panama Papers last year and a transparency international coordinator was assassinated.

The authors of this article have asked for anonymity. 

Featured Photograph: Kigali Convention Centre dome (2014)

Notes

[1] Ravallion, M. 2003. “Measuring Aggregate Welfare in Developing Countries: How Well do National Accounts and Surveys Agree?” Review of Economics and Statistics 85(3): 645–652

[2] The do-files required to estimate average household consumption are the same ones that were published in the previous blogpost. Once the do-file has run its course, you simply need to run the following command to obtain average household consumption: svy: mean adtot. For EICV2 use this do-file (click here to download the file). For EICV1, we used the figures in Table 2, page 13 in: McKay, A. (2015). The recent evolution of consumption poverty in Rwanda (No. 2015/125). WIDER Working Paper.

Source: A Review Of African Political Economy (ROAPE)

The Evidence Mounts: Poverty, Inflation and Rwanda

By Sam Desiere

In a recent blogpost an anonymous researcher on roape.net showed that poverty in Rwanda has increased from 2011 to 2014 by 5 percentage points. This contradicts the official poverty statistics and narrative, which claim that poverty decreased by 5.8 percentage points, namely from 44.9% in 2011 to 39.1% in 2014 (NISR, 2015). Importantly, the author published the Stata-files used to analyse the data of the EICV 3 and EICV 4 household surveys, enabling other researchers to verify his claims.

Recently, I also calculated trends in poverty using the same datasets. Although I used a slightly different (and, arguably, less sophisticated) methodology, the results confirm that poverty did not decrease. In addition, I show that the poverty trends are very sensitive to the inflation rate used. With an inflation of 16.7% (as reported by the National Institute of Statistics of Rwanda, NISR), poverty indeed decreased by at least 5 percentage points. With an inflation rate of 30% – which is in my view more in line with the ‘real’ inflation rate – my estimates show that poverty increased by 1.2 percentage points.

The fact that two researchers arrive – independently from each other – at the same conclusion, strengthens my belief that the EICV surveys show that poverty in Rwanda has increased. This has important implications for the current debate about (rural) policies in Rwanda, but I leave a discussion of these implications to researchers and policy makers more familiar with the reality on the ground and focus in this blogpost on the technical aspects of estimating poverty trends.

In this this post, I briefly describe my methodology and key findings and discuss (food) price inflation, which turns out to be a critical parameter. The Stata do-files required to replicate my findings can be found here.

Methodology

Rwanda’s poverty estimates are based on the Integrated Household Living Conditions Survey (EICV by their French acronym), which are conducted every three years. I used data from EICV 3, conducted in 2010/11 and EICV 4, conducted in 2013/14, which are made publicly available by the NISR. More specifically, I used the modules on food consumption purchased on the market and food consumption from own production. In both waves, the questionnaire of both modules is nearly identical. Food consumption is reported for more than 100 food items.

Unlike the anonymous researcher, I did not use the modules on non-food expenditure. I did so for two reasons. First, the NISR reports that most households spend over 60% of their budget on food. Hence, food expenditure is a good proxy of poverty. Second, non-food expenditure would require some additional data cleaning, which requires additional assumptions. Hence, I simply calculated food expenditure in both waves.

The meta-data of EICV 4 (available on NISR’s website) clearly stipulates that each sampled household in Kigali was visited 11 times over a period of 33 days. The modules on food consumption were administered during every visit. Rural households were visited 8 times over a period of 16 days. The meta-data of EICV 3, however, does not provide information on the number of times a household was visited. I simply assumed that the same methodology, for both rural and urban households, was followed in wave 3 as in wave 4. If this assumption is wrong – something I could not check – the results presented below will be erroneous.

In both waves, households reported how much they had spent on food purchased on the market by food item since the previous visit of the enumerator. I simply added up expenditure on all food items. Households also reported how much they had consumed from own production. Converting the consumption from own production in monetary values was more challenging. Households typically reported consumption from own production in kg. Some households also reported in the same module how much they would have paid on the market for this food item. I used this information to calculate the median, national price for each food item and used this price to convert consumption from own production in its monetary value. Since relatively few households reported prices, I did not attempt to calculate region specific prices nor did I correct for price seasonality. On this point my methodology differs from the anonymous researcher, who calculated a Laspeyres price index to account for spatial and temporal price variation.

To verify my assumptions, I checked whether my estimates of food expenditure are correlated with the household poverty status as reported by the NISR and included as a separate variable in the datasets. In both waves, food expenditure was lower for households classified by the NISR as extremely poor compared to household classified as poor, and the expenditure of this group was in turn lower than the expenditure of non-poor households. These results, available upon request, confirm that my assumptions are at least partially similar to the assumptions of the NISR.

Food expenditure can only be compared between the waves if the food inflation rate between 2010/11 and 2013/14 is known. I used two different inflation rates. First, I used an inflation rate of 16.7%, which is reported by the NISR (NISR, 2016, p. 43). Second, I estimated inflation based on food prices reported by the respondents, which I also used to convert food consumption from own production in monetary values. Inflation is then defined as a weighted average of the price increase of nine important crops. I used the same weights as those used by NISR to construct the 2013/14 adjusted food poverty line (NISR, 2015, table B4, p. 38). These estimates of inflation will be discussed in greater detail below.

Since I did not calculate total expenditure, but only food expenditure, I could not use the poverty lines proposed by the NISR. I therefore followed the ‘inverse’ methodology. First, I assumed that the NISR correctly estimated poverty in 2010/11 (44.9%) and used this information to determine the food expenditure threshold in 2010/11 prices that corresponds with this poverty rate. Second, I deflated food expenditure in 2013/14 using two different inflation rates, namely 16.7% and 30%. The first inflation rate corresponds with the inflation rate used by the NISR and thus allows me to replicate the findings of the NISR. The second inflation rate corresponds with my own estimate of inflation using the price data from EICV 3 and EICV 4. Third, I used the food expenditure threshold as an alternative to a poverty line to estimate the poverty rate in 2013/14. This approach is valid because I am not interested in ‘absolute’ poverty figures, but only in poverty trends.

In all analyses, I used the population weights to make the results nationally representative.

Results

Poverty trends

Using the EICV 3 and EICV 4 datasets, I calculated food expenditure per adult equivalent, respectively in 2010/11 prices and 2013/2014 prices. In order to estimate poverty trends, food expenditure in 2013/14 has to be deflated to express it 2010/11 prices. Poverty trends are very sensitive to the inflation rate used to deflate food expenditure. Results are presented for two inflation rates: (1) an inflation rate of 16.7% as reported by NISR and (2) an inflation rate of 30%, which is at the lower end of my inflation estimates based on ESOKO price data or EICV price data (see below for a discussion of inflation).

Figure 1 shows cumulative frequency distributions of food expenditure for these two situations, while table 1 summarizes poverty trends

With an inflation rate of 16.7% (left panel, figure 1), real food expenditure per adult equivalent increased for all households from 2010/11 to 2013/14 and, as a result, poverty decreased. Assuming a poverty rate of 44.9% in 2010/11 (which corresponds to a food poverty line of 100,232 RWF per adult equivalent), poverty decreased by 7.9 percentage points. This poverty reduction is even more pronounced than reported by official statistics, which states than poverty decreased by 5.8 percentage points.

With an inflation rate of 30% (right panel, figure 1), food expenditure does no longer increase between 2011 and 2014 for all households. Again assuming that poverty is 44.9% in 2010/11, poverty even increased by 1.2 percentage points.

Figure 1: Cumulative distribution of food expenditure per adult equivalent for EICV 3 and EICV 4 for an inflation rate of 16.7% and 30%

Table 1: Poverty trends in function of the inflation rate

  Inflation: 16.7% Inflation: 30%
Poor HH EICV 3 (official statistics) 44.9% 44.9%
Poor HH EICV 4 (own estimates) 37.4% 46.1%
Trends in poverty (percentage points) -7.5 +1.2

In sum, the poverty trends are very sensitive to the inflation rate. With an inflation of 16.7% from 2011-2014, poverty decreased by at least 5 percentage points, which is in line with the official reports. With an inflation rate of 30%, poverty does not decrease. The question thus boils down to an accurate estimation of the inflation rate between 2011 and 2014.

Inflation rate

The EICV survey is not an ideal dataset to estimate inflation, because it does not contain much information on food prices. As explained earlier, some households report prices for those food items consumed from own production. This does not only mean that the number of observations is relatively limited, but also that households report prices of those items they did not buy on the market. I nevertheless used this information to calculate mean and median average prices by food item. I calculated national averages without taking into account price seasonality or regional price differences. In order to estimate ‘average’ inflation, a weighted average is taken over nine crops. The weights are proportional to the weights used for the construction of the 2013/14 adjusted food poverty line (NISR, 2015, table B4, p. 38). These nine crops account for 86% of the total calorific intake of the food basket. Two crops dominate this index: cassava (fermented) (weight: 38%) and dry beans (weight: 25%).

Figure 2 shows the increase in mean and median prices between 2010/11 and 2013/14 for nine crops, while the horizontal lines indicate the weighted average. The increase in median prices ranges from 10% for sorghum to 50% for cassava (both flour and roots). Median and mean inflation are 33% and 42%, respectively. This corresponds to an annual inflation of 9.5% and 12.5%, respectively.

Figure 2: Price increase for nine crops from 2010/11 to 3013/14 (mean and median prices)


These inflation estimates are substantially higher than the ones reported by NISR, which states that food prices increased by 16.7% between Jan 2011 and Jan 2014 (NISR, 2016, p. 43). Moreover, the estimates based on the EICV surveys are remarkably similar to the estimates based on detailed ESOKO price data, where I estimated inflation at 30.5% over the 2011-2014 period (details not reported here).

In sum, I believe that the ‘real’ food inflation rate is substantially higher than the one used by NISR to estimate poverty trends. This probably explains why I find that poverty increased, while the NISR reported that poverty decreased. These findings raise concerns, not only for Rwanda’s (rural) policies, but also for international donors that have presented Rwanda as a model for development because of the supposedly strong poverty reductions.

Sam Desiere is currently a senior researcher at HIVA, the research institute for work and society of the University of Leuven, Belgium. In 2015 he obtained a PhD in agricultural economics from Ghent University, Belgium, which focused on data quality of household surveys in developing countries.

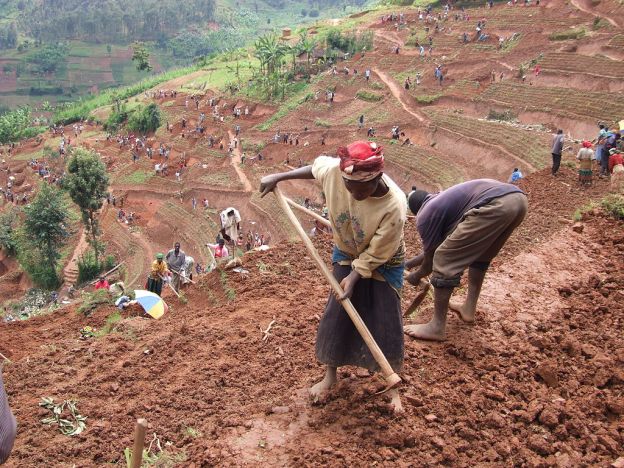
Featured Photograph: As part of the DFID funded Vision 2020 Umurenge Programme (VUP), Rwanda’s flagship Social Protection Programme, women and men in northern Rwanda work on a public works site in 2012, building terraces to prevent soil erosion

Source: A Review of African Political Economy (ROAPE)

Rwandan Poverty Statistics: Exposing the ‘Donor Darling’

In his book entitled Poor Numbers, Morten Jerven cautioned against taking African development statics at face value, given the high political and financial stakes attached to these numbers, as well as the lack of institutional mechanisms to prevent political interference in many countries. Few countries illustrate his case more starkly than Rwanda. As An Ansoms et al pointed out in an article in the print issue of ROAPE earlier this year, ‘Statistics versus livelihoods: questioning Rwanda’s pathway out of poverty, the Rwandan government has used its record on poverty reduction and economic growth to legitimize its authoritarian rule and to deflect criticism of its human rights record, just as the previous regime had done up until 1990. Furthermore, Rwanda’s spectacular recovery after the genocide has made it somewhat of a “donor darling”, and has enabled the government to attract significant foreign resources in the form of aid from donors desperate to claim a share in this African success story.

Yet, questions have been mounting in recent years about the reality and sustainability of the “Rwandan miracle”, given the heavy-handed nature of the state-led agricultural transformation project (Dawson et al. 2016), and the government’s propensity for debt-financed investments in unproductive prestige projects, such as the Kigali Convention Centre. These questions came to a head in September 2015, when the National Institute of Statistics of Rwanda (NISR) published a poverty profile (NISR, 2015) based on the most recent household budget survey (EICV4 by its French acronym). The report claimed that the proportion of Rwandans living below the poverty line had fallen from 45% in 2010 to 39% in 2014, after a string of similarly successful decreases in the previous surveys. Two months later, Filip Reyntjens published a critique, claiming that the “decrease” in poverty had been artificially engineered by NISR by changing the type of poverty line used, from an “average” consumption basket based on actual consumption patterns of poor Rwandan households, to a “minimum” or “optimal” consumption basket, containing mostly highly caloric and inexpensive food types.

The change is not in itself problematic, as the choice of a poverty line is always, to some extent, arbitrary and there are many different acceptable ways to define a poverty line. The normative minimum consumption basket adopted by NISR is one such way. However, to make trend comparisons, all experts agree that it is crucial to use consistent methodologies, assumptions and definitions across time. Reyntjens claimed that had they done that, they would have found the proportion of people living below the minimum poverty line to have increased by 6 percentage points between 2010 and 2014. Unfortunately, Reyntjens never published the syntax files he used to compute his estimate. Neither did NISR accept to publish its own syntax files. Without this key piece of evidence, the debate has never been closed from a technical point of view, as it is impossible to show convincingly whether poverty has actually increased or decreased in Rwanda between 2010 and 2014.

We hope to contribute to settling this issue by publishing open, transparent and verifiable syntax files built using a publicly available dataset, which can be downloaded from NISR’s own microdata catalogue on its website (the two syntax files can be opened with .txt notepad or STATA software here). There are many ways to compute these things and there are innumerable adjustments and assumptions that must be made to arrive at an aggregate number. Consequently, it is difficult to replicate exactly the official estimates without access to the original syntax files. However, we hope that by submitting these to public scrutiny, such differences can be ironed out in an open and transparent manner, and any mistakes can be corrected to arrive at an estimate that all parties can accept. In constructing these estimates, our main priority has been to ensure consistency between the two surveys. We therefore try to use exactly the same code and assumptions in both years wherever possible. Below, we provide an overview of the key parameters and assumptions that entered the construction of these indices. Since there are several different poverty lines that have been generated by now, we decided to compute trends for all of them, namely:

  • Average consumption basket: representing the minimum amount required to consume 2,500 kcal per day (adjusted for age and gender), using prevailing culinary habits of poor Rwandan households in 2001. This was the official poverty line used in 2001, 2005, 2010.
  • Updated average basket: representing the minimum amount required to consume 2,500 kcal per day (adjusted for age and gender), using prevailing culinary habits of poor Rwandan households in 2014. This was the new poverty line computed by NISR in 2014, which should have been used in EICV4, but was never used because it was deemed too high.
  • Minimum consumption basket: representing the minimum amount required to consume 2,500 kcal per day (adjusted for age and gender), using optimal (i.e. cheap and highly caloric) food types. This was the official poverty line used in 2014 (EICV4).
  • Reyntjen’s poverty line: Reyntjens argued that since the minimum consumption basket was 19% lower than the updated average basket, trend comparisons with 2010 should have been made using a poverty line that was 19% lower than the one used in 2010.[1] For this poverty line, we did not construct a food basket, but simply calculated 81% of the figure from the total poverty line computed from the average consumption basket.


In all consumption baskets, the quantities and caloric values are kept constant across surveys. Prices for each item are given as the national median price across regions and across months, as reported in the auto-consumption module of the EICV survey (see table 3 below). Consumption aggregates have been adjusted for spatial and temporal price differences using a Laspeyres index (see table 2 below). The Laspeyres index was chosen because it yielded estimates that were closest to official poverty estimates in EICV3 for the average basket. The choice of price index does not affect the conclusions of this blogpost.

The results are reported in table 1 below. All poverty lines yield similar trends when used consistently over time, indicating that poverty increased between 5% and 7% points between 2010 and 2014. All changes are statistically significant at the 5% level.

It should be noted that our results differ from those obtained by simply updating the poverty line for inflation using CPI data, as was done by NISR in their 2016 trend report (NISR, 2016). In principle, if the data are of good quality and sufficiently disaggregated, both methods should be equivalent and should not yield significantly different results. This therefore raises questions about the quality / reliability of official CPI data, and/or the quality of price data collected by the EICV. In either case, this would undermine our ability to correctly estimate poverty levels in Rwanda. The discrepancies found here should invite us to more closely scrutinize official statistics coming out of the Rwandan statistical office. GDP growth figures appear to be incompatible with the findings of the EICV survey, given than agriculture still accounts for about one third of GDP and two thirds of the labour force.

Tables

Table 1: Summary of poverty lines and poverty rates

Average basket Updated basket Minimum basket Reyntjen’s poverty line
2010 2014 2010 2014 2010 2014 2010 2014
Share of non-food[2](% of total cons.) 31 34.8
Total caloric intake (kcal/ adult/ day) 1346 1215 1212
Total food cost per pers./year (Rwf) 96,797 121,795 98,069 125,504 77,559 101,116
Non-food component (Rwf/ pers/year) 43,489 54,720 52,344 66,987 41,397 53,899
Total poverty line (Rwf/ pers/ year) 140,286 176,515 150,413 192,491 118,956 155,015 113,632 142,977
Poverty rate (% of pop< tot. pov. Line) 45.2 50.2 49.2 55.8 35.2 42.2 32.5 37.1
Change in poverty rate +5* +6.6* +7* +4.6*
*Change is statistically significant at 5% level


Table 2: Laspeyres price index by quarter and province (computed from price data in auto-consumption file)

2010 Kigali City Southern Western Northern Eastern
First quarter 1.47 0.98 0.89 0.98 1.14
Second quarter 1.31 0.98 0.92 0.96 1.05
Third quarter 1.38 0.98 0.92 0.98 1.13
Fourth quarter 1.31 0.98 0.92 1.00 1.14
2014 Kigali City Southern Western Northern Eastern
First quarter 1.22 0.93 1.01 0.96 1.09
Second quarter 1.20 0.95 0.96 0.91 1.08
Third quarter 1.27 0.98 1.06 1.05 1.04
Fourth quarter 1.14 0.92 1.07 0.99 1.02


Table 3: Food baskets used to compute poverty lines

PRODUCE NAME KCAL/ 100G PRICE[3] QUANTITY CONSUMED (KG/ ADULT EQUIVALENT PER DAY)
AVERAGE BASKET UPDATED BASKET MINIMUM BASKET
both years 2010 2014 both years both years both years
Sweet potato 92 80 100 0.4033 0.3114 0.0915
Irish Potato 67 120 150 0.1763 0.1257 0.0242
Banana – cooking (Inyamunyo) 75 120 150 0.0573 0.0783 0.0227
Dry beans 341 300 400 0.1130 0.0758 0.0758
Cassava (root) 109 100 150 0.0410 0.0694 0.0694
Cassava (flour) 338 200 300 0.0134 0.0391 0.0063
Sorghum juice(Ubushera) 173 150 180 0.0000 0.0000 0.0000
Tomato 17 200 200 0.0106 0.0146 0.0146
Corn (flour) 363 300 350 0.0100 0.0184 0.0012
Cabbages 19 100 100 0.0207 0.0172 0.0172
Local Banana beer 48 300 300 0.0096 0.0000 0.0000
Avocado 119 90 100 0.0036 0.0143 0.0494
Amarante (small leafed green) 22 100 150 0.0124 0.0150 0.0150
Local sorghum beer(ikigage) 173 150 180 0.0150 0.0000 0.0000
Cassava (fermented) 362 150 200 0.0056 0.0113 0.1097
Dry maize (grain) 356 180 240 0.0103 0.0138 0.0225
Eggplant 21 150 200 0.0070 0.0082 0.0082
Cassava leaves 53 150 200 0.0068 0.0093 0.0093
Local rice 280 500 600 0.0027 0.0092 0.0035
Tarot/amateke 86 100 150 0.0098 0.0189 0.0476
Maize (fresh) 36 100 150 0.0065 0.0000 0.0000
Fresh milk 61 150 200 0.0010 0.0062 0.0062
Fresh bean 53 200 250 0.0002 0.0000 0.0000
Banana fruit (Imineke) 60 150 200 0.0038 0.0056 0.0028
Sorghum (flour) 343 300 350 0.0031 0.0051 0.0075
Onion 24 250 325 0.0017 0.0024 0.0024
Curdled Milk 75 200 200 0.0007 0.0053 0.0053
Local banana juice 48 200 200 0.0000 0.0035 0.0020
Groundnut flour 387 900 1000 0.0004 0.0000 0.0000
Sorghum 343 250 250 0.0253 0.0028 0.0143
Amarante (large leafed green) 22 100 170 0.0039 0.0028 0.0028
Pumpkin 19 100 100 0.0068 0.0058 0.0058
Pineapple 26 100 125 0.0002 0.0013 0.0013
Carrot 38 200 250 0.0003 0.0011 0.0011
Papayas 26 100 150 0.0006 0.0014 0.0014
Mangos 45 100 125 0.0000 0.0022 0.0074
Beef meat 150 1400 1400 0.0006 0.0016 0.0000
Green pea (fresh) 37 400 500 0.0006 0.0000 0.0000
Fish (fresh / frozen) 49 1000 1020 0.0005 0.0000 0.0000
Eggs 139 70 240 0.0007 0.0009 0.0009
Guava 17 70 100 0.0002 0.0000 0.0000
Soya (dry) 335 300 400 0.0000 0.0004 0.0004
Yams/Ibikoro 109 130 160 0.0000 0.0104 0.0104
Pepper 17 250 300 0.0002 0.0000 0.0000
Plums 24 425 600 0.0001 0.0000 0.0000
Pork meat 220 1150 1400 0.0000 0.0003 0.0000
Wheat (flour) 364 350 450 0.0001 0.0000 0.0000
Goat meat 164 1500 1800 0.0002 0.0000 0.0000
Orange (local) 34 200 200 0.0000 0.0002 0.0002
String bean 32 200 200 0.0068 0.0000 0.0000
Soya (fresh) 405 200 250 0.0023 0.0000 0.0000
Green pea (dry) 339 500 700 0.0010 0.0000 0.0000
Ground nuts (peanuts) 567 800 1000 0.0009 0.0001 0.0001
Fish (dry / smoked) 199 500 500 0.0000 0.0127 0.0127
Other Meats 126 550 800 0.0000 0.0000 0.0005
Bread 261 239 303 0.0011 0.0000 0.0000
Imported rice 363 460 583 0.0014 0.0000 0.0000
Palm oil 884 668 846 0.0036 0.0000 0.0000
Sugar (local) 380 500 634 0.0027 0.0000 0.0000

The authors of this article have asked for anonymity.  

Featured Photograph: Parc National des Volcans, Rwanda. August 4, 2005

References

Reyntjens, F. 2015. “Lies, Damned Lies and Statistics: Poverty Reduction Rwandan-style and How the Aid Community Loves It.” Blog of 3 November 2015 posted on http://www.africanarguments.org.

NISR. 2015. Rwanda Poverty Profile Report 2013/2014: Results of Integrated Household Living Conditions Survey. Kigali: NISR.

An Ansoms, Esther Marijnen, Giuseppe Cioffo, and Jude Murison, “Statistics versus livelihoods: questioning Rwanda’s pathway out of poverty”, Review Of African Political EconomyVol. 44 , Iss. 151, 2017.

National Institute of Statistics of Rwanda (NISR), Poverty Trend Analysis Report, June 2016.

Jerven, Morten. Poor numbers: how we are misled by African development statistics and what to do about it. Cornell University Press, 2013.

Dawson, Neil, Adrian Martin, and Thomas Sikor. ‘Green revolution in sub-saharan Africa: Implications of imposed innovation for the wellbeing of rural smallholders.’ World Development 78 (2016): 204-218.

Notes

[1] Note that Reyntjens argument is not strictly speaking correct, since it would still require us to compare two different consumption baskets. To be methodologically sound, the 19% reduction would thus need to be applied to the same basket in both years, as we are doing here.

[2] In the average consumption basket, the non-food component is computed based on the average food share for households in the 7th decile in 2001. In the updated and minimum baskets, the non-food components are computed based on the average food share for households in the 5th decile in 2014.

[3] National median price of product as reported in the auto-consumption module.

Source: A Review of African Political Economy (ROAPE)